Cryptocurrency
Data Collection
Overview of the cryptocurrency market and the importance of this type of research. I also discuss the process of collecting and manipulating cryptocurrency data.
Abstract
In this project, I uncover possible explanations for changes in cryptocurrency prices using Google Trends, stock market, and 2020 presidential election data. From 2019 to the beginning of 2021, the cryptocurrency market capitalization grew form $200 billion dollars to $2.4 trillion dollars. However, even the most popular cryptocurrencies, Bitcoin and Ethereum, continue to experience large price swings in both daily and long-term valuations. This volatility leads to over-optimistic investors and skeptical spectators, creating a whirlwind of contradicting information about the validity of the cryptocurrency market. Using a fixed effects model and Granger causality test, I aim to provide a data-backed explanation for changes in digital currency prices. I find that Google Trends, stock market prices, and the 2020 presidential election are all useful in forecasting and predicting changes in cryptocurrency prices. However, while the results are statistically significant, it is important to note the assumptions needed to claim a causal relationship between these variables are likely violated or impossible to prove. Regardless, the findings from this project are aimed to give potential cryptocurrency investors another data-backed account to understand influences on the cryptocurrency market.

Overview
Cryptocurrency was introduced back in 2009, by a person or group named “Satoshi Nakamoto”. Along with the introduction of Bitcoin, “Satoshi Nakamoto” published a paper titled “Bitcoin: A Peer-to-Peer Electronic Cash System”. In the paper, the author(s) describe a payment system in which there is no third party needed to validate the transaction. Using a shared ledger on a peer-to-peer network, all transactions are verified by the network, making it impossible to forge ownership. This innovation is referred to as the “blockchain”. Cryptocurrency is just one application of blockchain technology. We also see it used in security, privacy, healthcare, voting, and countless other examples.
A little over ten years later, the total cryptocurrency market capitalization reached $2.4 trillion dollars, Bitcoin and Ethereum (the second largest cryptocurrency) accounting for over 50% of the value. Given this astonishing growth and significant value these digital currencies now have, businesses and individuals are using digital coins as both a currency for transacting and as a form of investment. To facilitate this growing interest, companies like Coinbase, Venmo, Square, and Robinhood have built platforms that make investing in cryptocurrency increasingly accessible to the average person.
Data Description
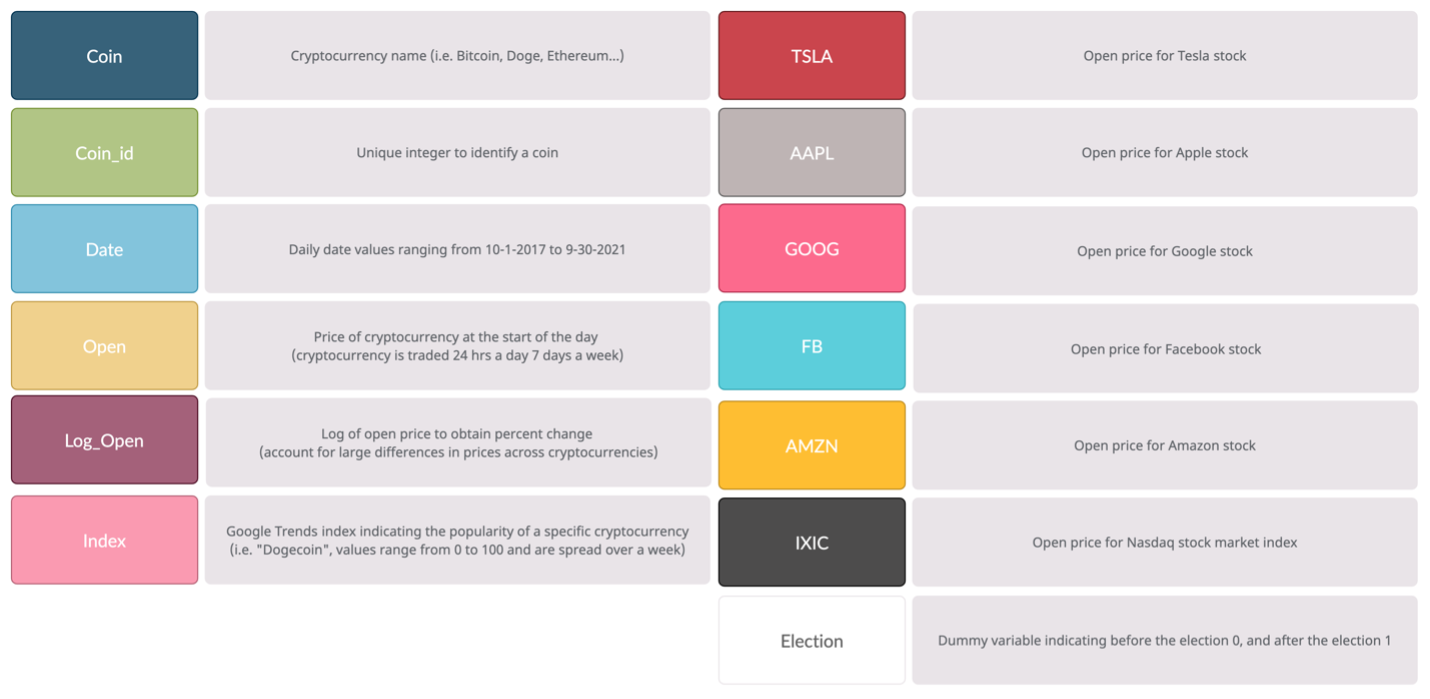
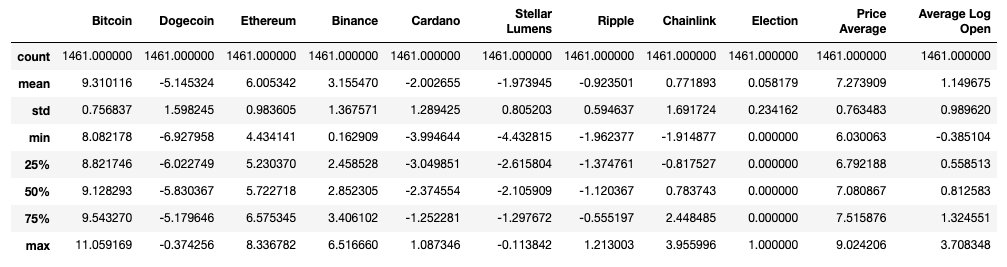
For the main analysis, I aggregate all data into a balanced panel data frame, with data ranging from October 1, 2017, to September 30, 2021 across 8 different cryptocurrencies. The final dataset includes 11,688 rows, with each cryptocurrency having 1,461 observations (days). Each row represents a cryptocurrency on a single day, with the following columns describing trading activity that occurred over that day. The currencies I include are Bitcoin, Dogecoin, Ethereum, Binance, Cardano, Stellar Lumens, Ripple, and Chainlink. These eight digital currencies have large amounts of historical data and vary drastically in terms of their perceived risk.
Despite the success of cryptocurrency in the last ten years, volatility and uncertainty remain major concerns. Skepticism over cryptocurrency being a viable way to transact and very little understanding over what causes changes in prices leads many individuals to avoid cryptocurrency all together. To contribute to the conversation and provide more clarity, I will explore the possible explanations for changes in cryptocurrency prices using Google Trends, stock price, and the 2020 election data.
Dependent Variable
For the dependent variable, I transform open price to log open price to account for the large difference in prices across cryptocurrencies. This cryptocurrency data comes from Yahoo Finance which provides variables such as open price, close price, high price, and volume traded. The cryptocurrency market is open 24 hours a day, 7 days a week, making the open price a measurement of the current price at the start of a new day.
Independent Variables
Google Trends provides information on how popular a given cryptocurrency is relative to other search terms during that time. In addition to the specific digital coin search terms, I also include a column for the search term “Cryptocurrency”, which can be used as a control variable. The score given my Google Trends ranges from 0 to 100, 0 indicating there is not enough data for that day and 100 meaning the search term reached a maximum search popularity. It is important to note, because Google accounts for more than 90% of all internet searches, this dominance allows Google Trends data to be a good proxy metric for the general interest of cryptocurrency at any given time.
The data set also includes stock market opening price data for leading technology companies such as Google, Facebook, Apple, and Amazon as well as a metric to track the Nasdaq stock market index. Given the stock market is open 5 days a week and the Cryptocurrency market is open 7 days a week, I choose to use the Friday open price as the weekend open prices as well.
The election variable is a binary variable indicating dates before and after the 2020 presidential election. A 0 indicates not during the election and a 1 indicates during the election. Due to the timeline of the 2020 election, in which there was uncertainty if Biden would take office January 20th, I chose to have the election dates range from November 4th, 2020, to January 27, 2021. I believe setting the election to this month and half period should capture the full effect the election may have on Cryptocurrency prices as the transfer of power remained highly uncertain until January 20th.